2026-08-09
How I Built a Wind Tunnel in Python
Hey! Are you an amateur cyclist who wishes you had access to a wind tunnel like the pros do, or maybe you're a causal inference expert who wants to read about interesting applications. Well boy is this the article for you!
This is a technical blog post about the methods I used to build an app based on the Strava API that lets users determine a bikes effect on their speed. Basically this app is meant to emulate the way that a pro could go into a windtunnel and learn that bike A lets them ride 1 mph faster, or the same speed for 10 watts less.
Initial Overview
Here is the core methodology of my project. Speed on the bike is an equation that only has a few major factors, watt input, weight input, and gradient input and aerodynamic input. I believe all other factors like rolling resistance and air density are not impactful enough to even include in a model at this scale.
So speed = f(watts, gradient, weight, aerodynamics)
Watts are measured by my power meter, gradient is recorded on strava. This leaves us with weight and aerodynamics, both of which are a function of the rider and the bike as a system. But for this project's sake we can assume the rider part of this equation is unchanging. I then combine the weight and aerodynamic impact of the bike into -bike- and this is what I am looking to quantify.
Back to the equation we now have speed = f(watts, gradient, bike) with watts, gradient, and speed solved for so if we plug those numbers in we can get a value representing the bikes impact on speed. Of course in this section alone I have already brought up some things we're ignoring like rolling resistance and air density, and honestly there are plenty more. This is where the data science ideas come in and I trust that with a large enough sample size I can Central Limit Theorem these out.
I read a post from a Specialized engineer about the equation of speed. I actually read this after finishing this project, but still thought it was pretty cool. They are doing much more technical work, but it's the same core concept. Speed is the end result of a bunch of different things that go into a bike, and you can calculate/change most of them and then see how they come together and turn into speed. Where I am trying to quantify it, they are trying to maximize it.
I will go in depth 3 main sections; outlier filtering, causal inference, api architecture
Outlier Filtering
In my introduction I laid out a very clean equation. This is not the case in the real world. There are unmeasured factors affecting speed, some of which I have no way of measuring. Was I holding the brakes on a descent because I'm behind a car, am I fourth wheel of a peloton moving super fast for no effort? These are just 2 examples that could drastically increase or decrease my speed in a way my model wouldn't account for. This was not an easy problem to solve. Not to mention headwinds and tailwinds, both of which could make an effort unusable for my purposes.
At its core the problem is that I have outliers that it seemed I had no way of identifying because they were outliers in variables I did not measure that only came through in their effect on my target variable. So I decided to use this effect on the target variable to identify them. At some point people learned that on a bike speed scales to the cubic root of power. This is primarily due to the exponential effect of drag. It also explains why I can hit about 30 mph at 750 watts, but cannot go 60 mph when creating 1500 watts.
Using this logic I decided that each segment I am analyzing should have its own relationship between watt and speed, but it should be consistent and should map to this understood concept from physics. A downhill segment would have a higher Y intercept, but when plotting speed, it should map to cube root of power. A large deviation from this suggests breaking the rules of physics - an outlier. Me hitting the brakes would put me a few standard deviations below this trendline, and me sitting fourth wheel would put me a few above it.
Limitations of this strategy do exist. For example, it isn't great on downhills where watts can legitimately be 0 and have no effect on speed. Still I have found it is pretty good at identifying efforts that would throw off my modeling.
Here is a visualization of it in action. Notice how the efforts do conform to that cube root line. There is a trend that the faster ones seem to pull up above it, I think this is because I more commonly have slower efforts so the fit is focused down there. I include a flat segment and a climb segment to show how while one has a Y intercept around 25, and one is around 20, they still both follow this relationship we get from physics. You will see outliers highlighted in red, these are examples that I will exclude from the model because their deviation from the trend suggest to me there was an unmeasured external factor at play.
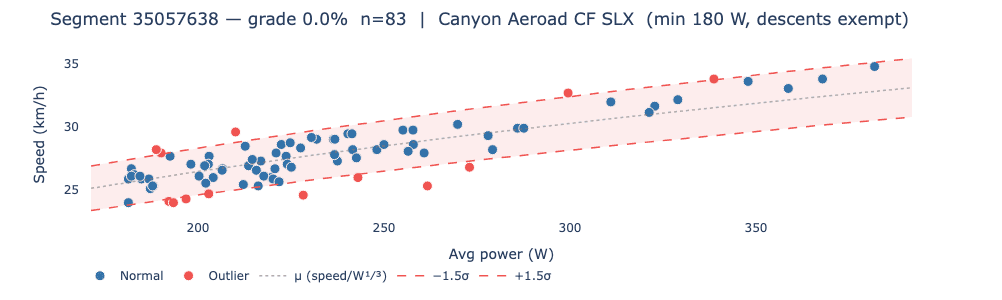
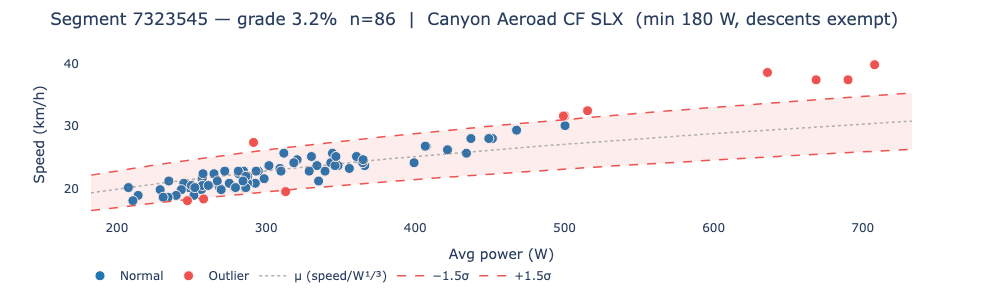
I did do some spot checking and can attribute some of these outliers to commutes where I drafted with my coworker Chang!
Causal Inference
This is the technical bulk of the project and will have its own subsections
Not Using DML
The method of causal inference I am most familiar with is Double Machine Learning or DML. This is quite an intuitive method. Basically you train a model to predict the outcome given a set of factors, and then you train a model to predict the treatment given the same set of factors, and then you set up a regression of these 2 results and the coefficient of that is your causal estimate. In my bike example, I would combine data from both bike, and then model one would predict speed, model 2 would predict what bike I was on, and the regression would tell me the effect of which bike I was on on the speed I was riding at. This is where I started but I was not pleased with the results. Because my experimental design is such that I rode the Aeroad for about a year, and then got the SL8 and was at no point overlapping, time was such a huge confounding variable that I found this approach ineffective.
Using T-Learner Kind Of
T-Learner causal inference is actually not something I was familiar with before this project, and I kind of stumbled onto it while creating my own process. I will describe the process I decided to use and then give a definition of T-Learner to compare to the process I ended up with.
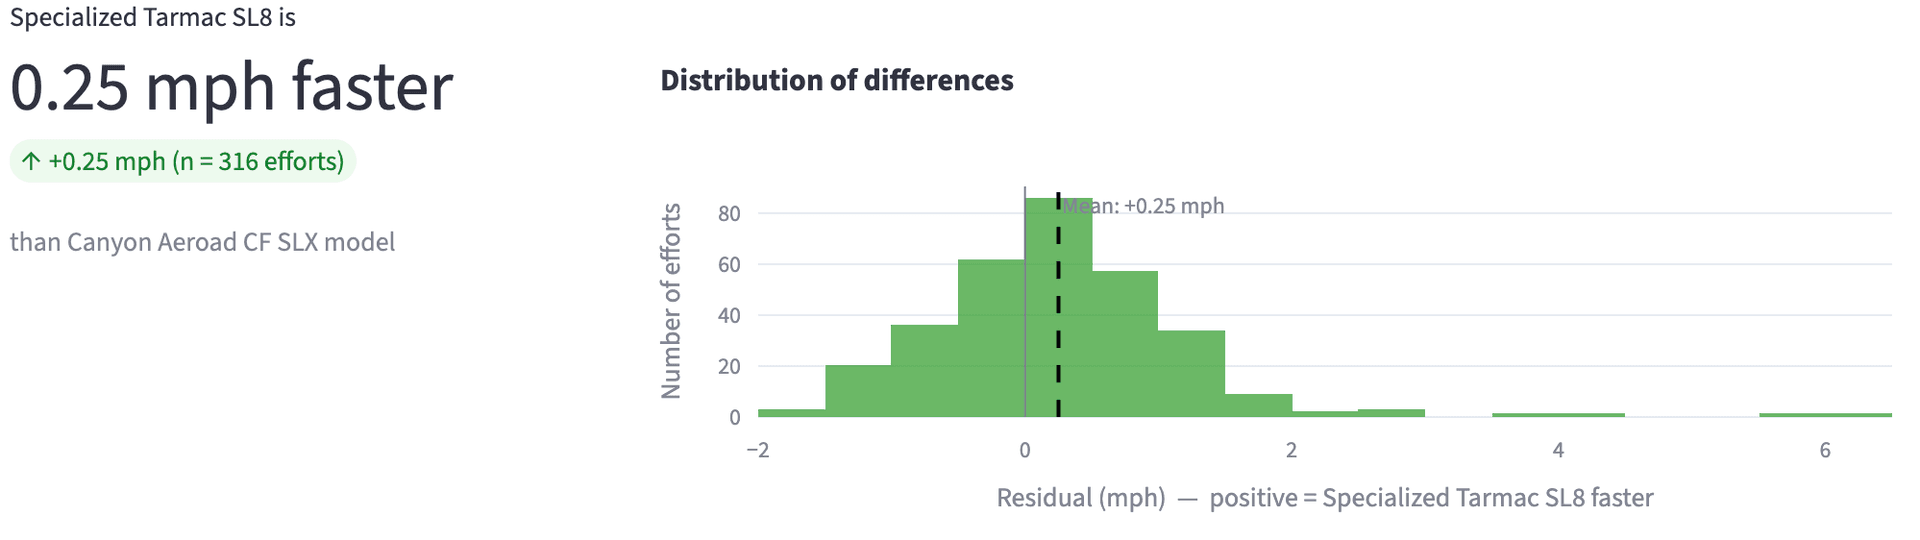
This is basically a residual analysis. Residual meaning the gap between predicted value and actual value. Using a model trained on bike A, I predict the speed bike A would have gone on one of bike B's efforts, and then treat that prediction as a counterfactual. Basically Imagine if every time I rode my Aeroad down a segment, a clone of me was riding next to me with identical power and conditions on my SL8. I can look at the speed difference between the speed of the effort I actually did, and the speed the model predicts I would have gone on the other bike under Identical circumstances. Record this residual, average it up over hundreds of segment efforts, and that is half of the prediction.
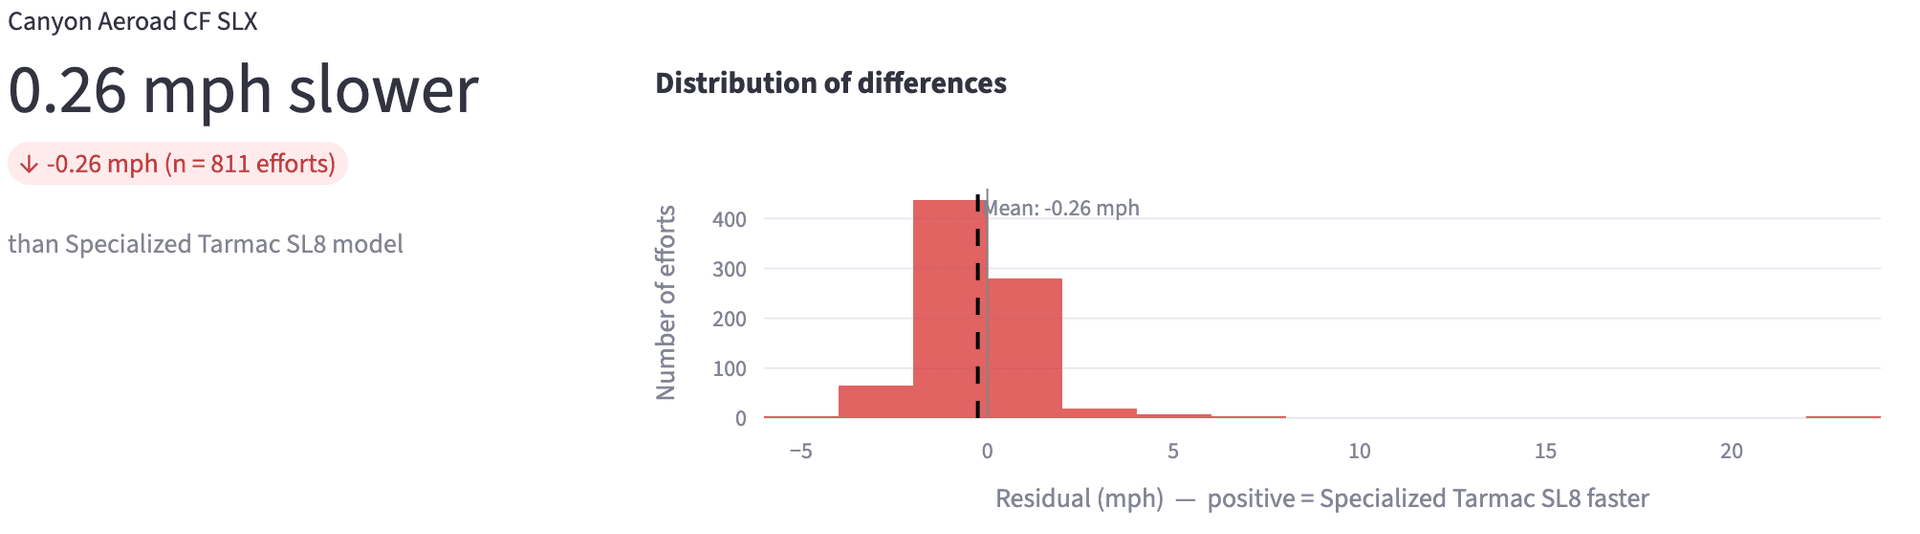
The other half is the same thing but flipped. I now train a model to predict bike B speed on bike B efforts, and then feed bike A efforts into the model to tell me how fast bike B would have gone if there was a ghost me riding next to me on bike B during my bike A effort.
The final piece of my model is bringing these together with a weighted average based on sample size to give a final estimate of the comparison between bikes.
So What is T-Learner and how close did I get with my homemade solution. T-Learner means two learner, and involves training 2 models. One for each treatment group. Then you combine the data sets, one for all treatment groups and you run it through both models. Then you take the difference between the predicted values from the 2 models and those are your counterfactuals. The word used in this methodology is treatment effect, and then when you average it all out it is the average treatment effect. A known limitation of T-Learners is that they can struggle with unbalanced sample sizes in treatment groups because the model trained on the smaller dataset can be sensitive to outliers which can come across as noise when applying the model to the other treatment group. This is likely relevant in my process as it will be a while until I have as many efforts on my SL8 as I had on my Aeroad. So the key difference is that in a T-learner it is prediction vs prediction while my process is prediction vs actual.
I will explain it with the bike example as if I had used it. Basically I would train a model on bike A and a model on Bike B, I would then feed all my efforts, through both models and compare prediction vs prediction instead of prediction against actual. I think this would probably make my process a bit more outlier proof because instead of using actual values I am only ever comparing model predictions, which are almost by definition not going to be outliers. Though I do like my solution because I like thinking about the example of a drag race between real me and ghost me on the other bike.
Here are some images from my process.
First, a model trained to predict SL8 speed is used to predict Aeroad speed on efforts the SL8 completed, and the residuals are recorded and averaged out.
Second, a model trained to predict Aeroad speed is used to predict SL8 speed on efforts the Aeroad completed, and the residuals are recorded and averaged out.
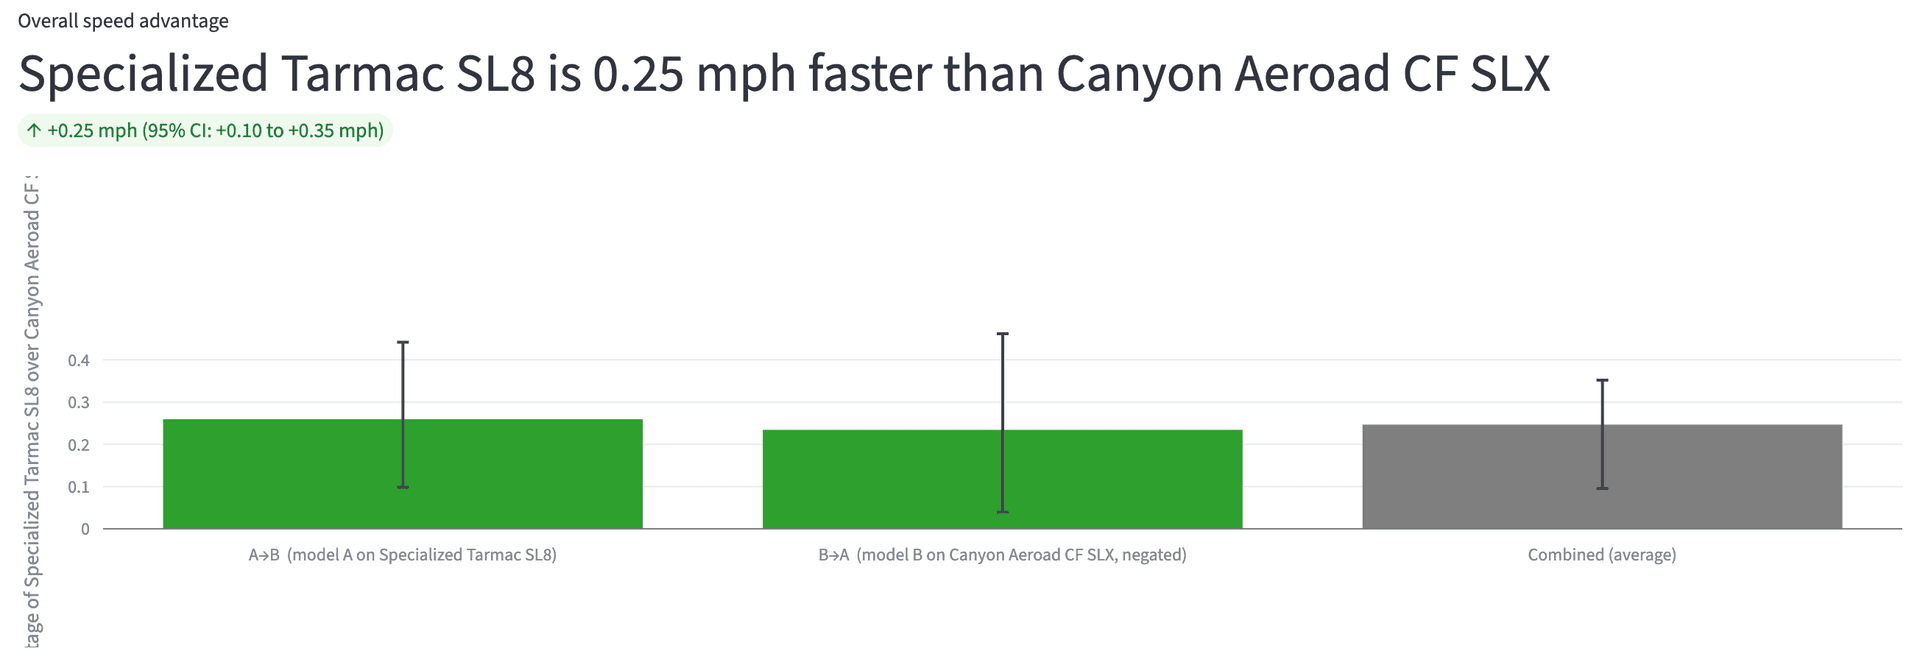
Third, a weighted average of these 2 results form our final causal estimate of bike speed. Notice the confidence interval on the result from the model trained on the SL8 is larger. This makes sence because the SL8 has less training data (for now)
Analyzing Result for Validity
So that is my process. On its own I think it is pretty cool. But I wanted to include some steps to help its result feel more trustworthy. I implemented a series of red flaggeds that get raised if conditionas are not met as well as some metrics to help quantify the confidence and trustworthiness of the result.
1. If the direction of the individual treatment effects disagree, this is a bad sign. IE if in step one I find out the SL8 is faster and in step 2 I find out the Aeroad is faster, even if the average says the SL8 is faster, it isn't very trustworthy. This test is built in and a warning will raise in the app.
2. If the confidence interval crosses 0, especially on the aggregate result, this is a bad sign. My confidence intervals are often pretty wide. The equation I laid out earlier may be more complex than I gave it credit for. But the app raises a flag if the confidence intervals cross 0 on either of the treatment effects, or the average treatment effect. This is a sign that the result is unreliable.
3. Symmetry of treatment effects. In real life the answer is perfectly symmetrical, these numbers are exactly opposite because they are the same thing. If the Aeroad is 1 mph slower than the SL8, the SL8 is 1 mph faster than the Aeroad. This one is basically the numerical version of the flag in number 1. My process includes a check that looks at how close to symmetrical the result is and the closer it is the more trustworthy I deem the result. In the example I included here the results are very symmetrical, 0.25 mph and 0.26 mph. This is confidence inspiring because those 2 results came from distinct models. I bucket percent differences into different degrees of concern to display to the app user.
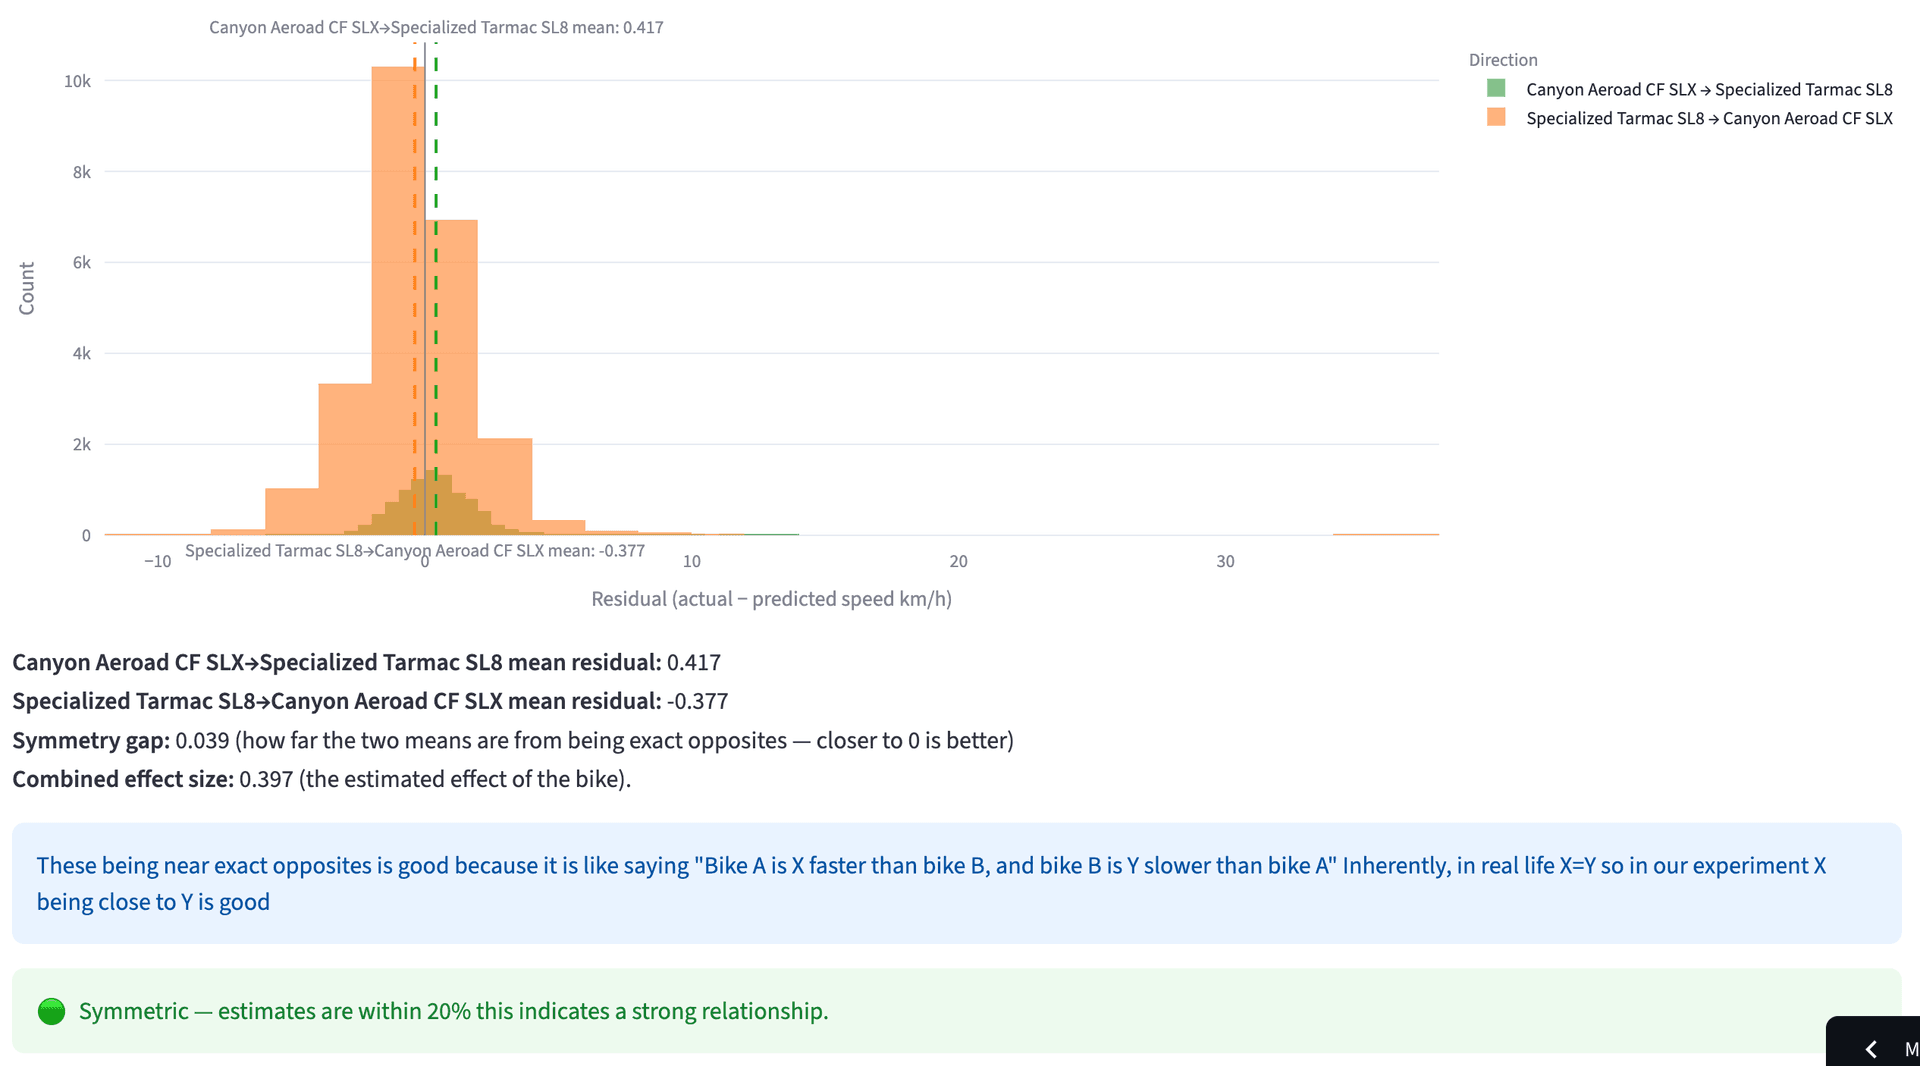
Note this viz is in kmph and the others are in mph, this is a bug I haven't fixed yet
4. Confidence interval width. This check compares the size of the treatment effect to the size of the confidence interval. If the confidence interval is a sizeable portion of the effect, it makes me less confident in the prediction. Even in the example I am sharing here, which I think is pretty good, the confidence interval is pretty wide compared to my claimed treatment effect, so the result should be treated with caution.
I had fun developing these methods of verification for my process. I do think they do a good job at guiding the user into having a good understanding of the validity of the result I am presenting.
API Architecture (Bonus Section)
This section turned into more of a puzzle than I expected it to be due to rate limits and API availability. Here are the puzzle pieces. Strava API has a limit of 200 read requests every 15 minutes and 2000 a day. The segment effort api response does not include gear id (Which bike was used) but does include a primary key mapping it to ride. The ride response api does include gear id, and includes a ride id which can be used to map it to segments, but does not include any data on segments hit on the ride. So to get a usable segment dataset, you would need the segment effort from the segment effort api, and then you'd need to join it to the response from the ride api to get the bike used.
I knew I wanted to do my analysis on a segment level because it inherently accounts for some variability like grade, and would increase my sample size. My initial plan was to pull all a riders rides and from that calculate their most common segments and use those. But you cannot pull segment info out of the ride api response so that was not an option. So I elected to go with starred segments as the segments I use for analysis.
So I developed what I thought was the best solution. Get all starred segments, then get all rides, then get all segment efforts on each of the starred segments. Segment efforts and rides responses are paginated at 200 per response, so I thought I would have plenty of room on the limit. I have around 1400 activities and 40 starred segments.
So I thought I was all set with this method. It did work for me and I actually developed most of the app under this functionality. Only later I had my buddy test it and he has a much larger ride volume than me. He hit the rate limit on activities and never got around to segment efforts so he essentially had no data. To resolve this I implemented a system where I systematically work backwards pulling all activities 200 activities at a time, and then all starred segments for the corresponding period. In this fashion even if rate limit is hit, a user will have some number of usable segment efforts and they can come back and query older efforts later if they want.
All the responses are stored in a database, so the user doesn't have to reload everything when they log in. This combined with the incremental update works well because I record when a user last loaded activities and then if they ever want to bring in more data they can just hit a button and use a small amount of requests to get data from whenever their last load was to now.
This was the surprise of the project. A trap I think most data scientists fall into time after time is underestimating the amount of work that will go into building the infrastructure needed to carry out their modeling. So this was an interesting process for me to tackle. I am happy with my solution but do see some weak points. I don't have an eloquent way to backfill if a user stars a new segment, and I am not fully optimizing the size of my window, it should be custom sized based off of the date range from a page of ride activities. I am curious if any 5 star SWEs read this to hear how they would approach the problem.
Conclusion
I learned a lot while working on this project, and I am especially surprised by how deeply some of these ideas have planted themselves in my thinking. There is something about working on a problem in a field you already care about that makes the concepts stick in a way a textbook never quite does.
The result the app gives me (that the SL8 is faster) is validating, and it being so close lines up with what I feel on the bike. They feel about the same speed to me. But I want to be honest about the biggest caveat I carry into that conclusion. I rode the Aeroad for a year and then switched to the SL8. All of my Aeroad data precedes all of my SL8 data. That means time is a confounding variable I cannot fully control for. While time might not matter the things that come with it do, my weight, the season, the routes im riding frequently. I have done my best to control for these things through segment matching and power normalization, but I cannot fully rule them out. The honest answer is that the data points in a direction, and I believe it, but I cannot prove it the way a wind tunnel can. A big part of data science is identifying quasi-experimental situations and doing your best to draw conclusions from them. That is what I have done here.
What I can say is that across three bikes I have data on, the results line up with my intuition. That is not proof but it is something.
I want to go deeper into causal inference. It was my entry point into data science through econometrics and this project reminded me why I find it so interesting. I also want more users on the app, both for the feedback and because more data from more riders will tell me whether the methods hold up beyond my own riding.
Check out the app. Even if you dont have a ton of bike data in strava I set it up so you can play around with mine. I would love any feedback on the app whether its you telling me my app told you your fastest bike was actually slow, or just wanting to talk about methods, don't hesitate to reach out!